

Xpro Addons

Pro Widget

Polar Area Chart Widget for Elementor 

Turn a spreadsheet into a chart your visitors actually look at — pull data from CSV or Google Sheets, style every segment, and drop it into any Elementor page in minutes. 

What Is a Polar Area Chart?  

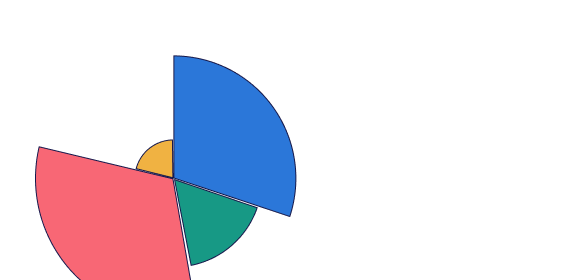
A polar area chart is a data visualization where all segments share the same angle, but each segment's distance from the center — its radius — represents its value. This makes it easy to compare category sizes at a glance while keeping the circular, at-a-glance format of a pie chart. It's a strong fit for showing rankings, seasonal patterns, survey scores, or any dataset where relative magnitude matters more than exact proportion. 

Complete Control Over Your Data & Design

Effortless Data Management 

No need to leave the Elementor editor to manage your data. Just add a Dataset Label, then add as many data items as you need. Give each one its own value and color — and whenever your numbers change, your chart updates right along with them. 

Precision Scale & Layout Settings 

Switch between smooth curved arcs or sharp flat arcs to match your style. Fine-tune the scale with Begin At Zero, Step Size, Scale Labels, and Grid Lines. 

Interactive Legend & Tooltips  

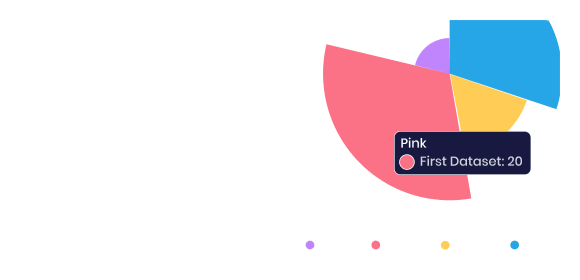
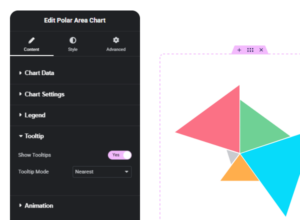
Turn the legend on or off, set its position, or reverse the order to fit your layout. Enable Nearest-mode tooltips so visitors see exact values just by hovering. 

Dynamic, High-Impact Animations

Make your chart spin in with Animate Rotation or grow from the center with Animate Scale — just set the Duration and Easing you want. Turn on Loop to keep the animation running for longer browsing sessions. 

  • Intuitive Interface

    Built natively into the Elementor workflow with clear toggles, not a buried settings panel

  • High Performance

    Lightweight output that won't drag down your page speed scores.

  • Visual Consistency

    Deep styling control over arcs, legends, and tooltips so the chart matches your brand, not a template default.

  • No-Code Data Updates

    Swap values, colors, and labels any time without touching a line of code.
Have Any Doubt?

Frequently Asked Questions

What's the difference between a polar area chart and a pie chart?

In a pie chart, each slice's angle changes to represent its value. In a polar area chart, every segment keeps the same angle, and the value is shown by how far the segment extends from the center. This makes polar area charts easier to scan when you want size comparisons to stand out visually.

Do I need to know how to code to use this widget?

No. The XPro Polar Area Chart widget is built entirely for the Elementor editor — data, colors, scale, legend, tooltips, and animation are all controlled through visual settings panels.

Can I control how many data segments the chart shows?

Yes. You can add as many data items as your dataset requires, each with its own label, value, and color.

Can I change how the chart looks on hover?

Yes. Tooltips can be enabled to show exact values when a visitor hovers near a segment, using nearest-point detection for accurate readouts.


Is this widget part of a free or paid plugin?

The Polar Area Chart widget is part of XPro Addons for Elementor, our premium (Pro) widget suite.

Download 150+ Addons & Start Creating Amazing Websites

40,000+ Happy Customers, Happy Agencies, Happy Freelancers Build Beautiful Websites Using Xpro Elementor Addons