Pro Widget
Bar Chart Widget for Elementor
Stacked or horizontal layouts, live tooltips, and full axis control — built directly into your Elementor editor.
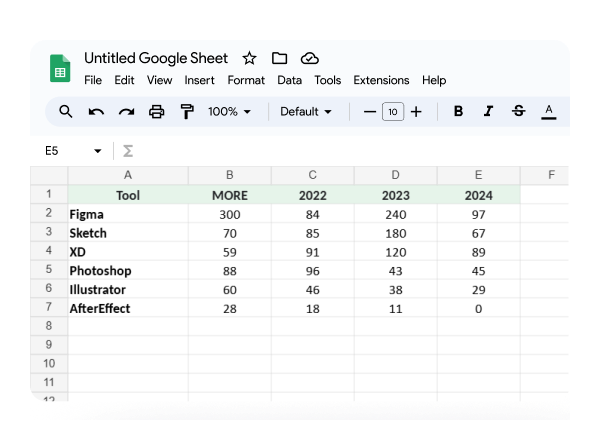
Seamless Data Management
Spreadsheets don't convert. If you're presenting pricing comparisons, survey results, growth stats, or product data on your site, a wall of numbers loses people before they read past row two.
The XPro Bar Chart widget turns that data into a chart your visitors can actually scan in three seconds — built inside Elementor, with no custom code and no separate charting plugin to maintain.
How WordPress Bar Chart Works

Instant Category & Dataset Controls
Enter categories as comma-separated labels — January, February, March — and the widget builds your chart structure automatically. Add, duplicate, or remove datasets with one click.
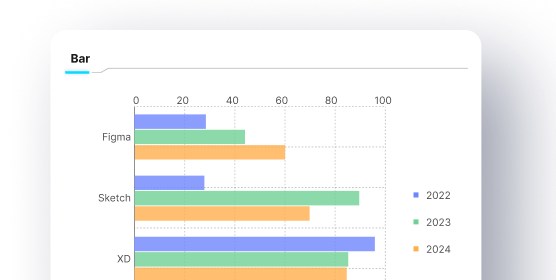
Horizontal and Stacked Bar Chart Layouts
Switch between vertical and horizontal layouts, use stacked charts to combine values in a compact bar, customize the axis range and step size with scale controls.
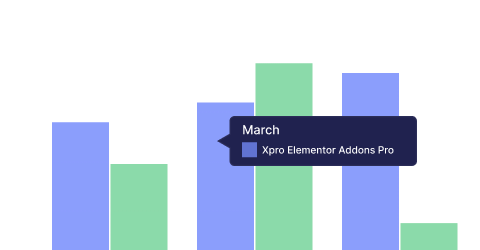
Make It Interactive
Turn on tooltips to show exact values on hover, customize the background, border, padding, and caret size, choose how data points trigger tooltips, and style the title and body text independently.
Legends and Animation
Position your Legend at the top, bottom, left, or right; choose a point style like Circle, triangle, etc. Add an entrance animation with adjustable duration and easing so the chart draws attention without feeling gimmicky.
Why This Elementor Chart Plugin Is Different
Built for Elementor, not bolted onto it.
No iframe embeds, no external chart libraries slowing your page down — it's a native Elementor widget, styled and controlled from the same editor.
Precision when you need it.
Most chart plugins give you defaults. XPro gives you defined scale ranges, step sizes, and independent axis controls for when "close enough" isn't good enough.
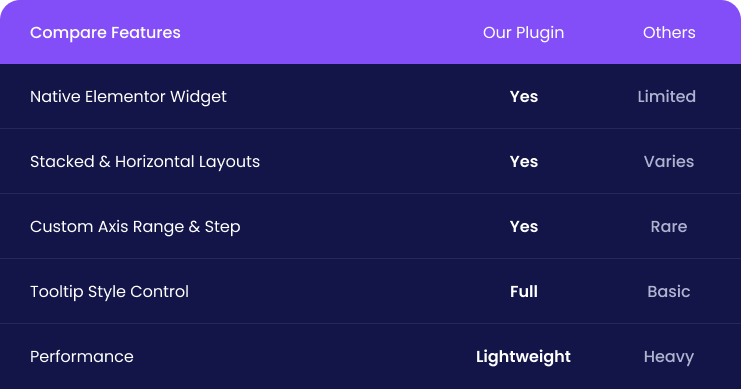
Use Cases
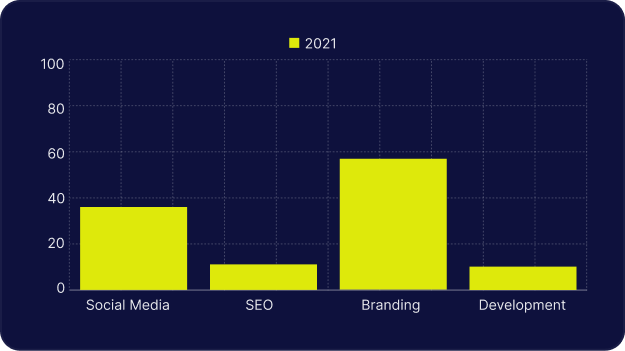
Agencies Sites
Presenting campaign performance or before/after metrics to clients.
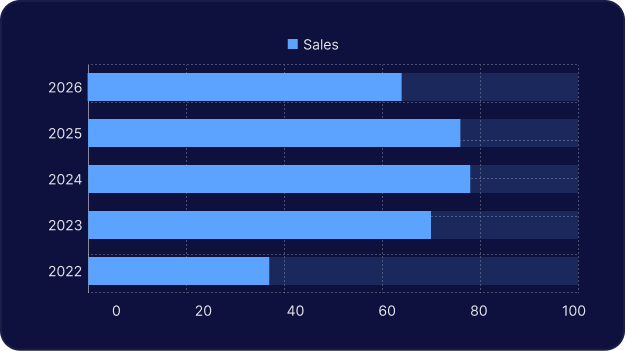
E-commerce Sites
Showing product comparison stats or seasonal sales trends
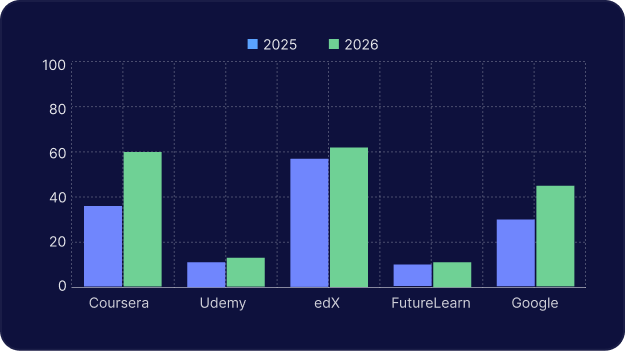
Educational Sites
Displaying survey results or impact data.
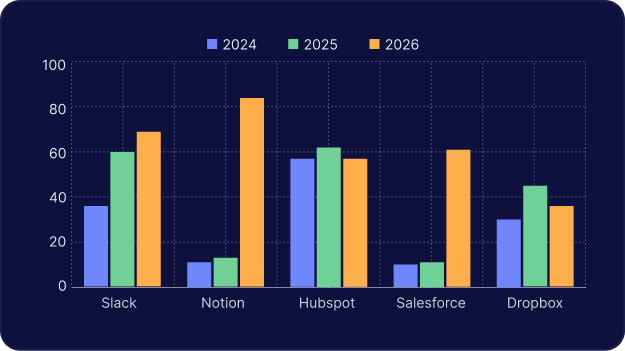
SAAS Sites
Comparing plan features or usage tiers.
Have Any Doubt?
Frequently Asked Questions
How do I create a stacked bar chart in Elementor?
Open the Chart Settings tab in the widget and toggle Stacked Chart to "Yes." Your existing datasets will render as cumulative segments within a single bar.
Can I customize the grid lines?
Yes. X Axes Grid Lines and Y Axes Grid Lines are controlled by independent toggles, so you can adjust background detail without affecting the rest of the chart.
Can I change the legend position?
Yes. Use the Legend Position dropdown to choose Top, Bottom, Left, or Right.
Does the chart work on mobile? Yes. The widget is fully responsive across mobile and tablet screens, so your charts resize and remain readable on any device.
Do I need coding knowledge to use this widget?
No. All chart settings — data, layout, axes, legend, and animation — are configured through Elementor's visual editor.